Every piece here so far has answered the same question one case at a time. Health care: fake. The Strait of Hormuz: real. That works, but it has a weakness. A framework that only ever speaks in essays can always find a way out of its own verdicts afterwards.
A number cannot do that. So this one builds a number.
One reading, once a quarter, that says whether credit has started faking a shortage. It has a definition, a line it either crosses or does not, twenty years of history with two clean crossings fifteen years apart, and a needle pointing somewhere right now.
What it actually measures
Faking a shortage is not the same as tight money. Tight money during a genuine shortage is the system doing its job, as it did during the supply chain crisis and again during the oil shock.
Faking is tight money while the shelves are full. Money squeezing an economy that has idle factories and willing workers, and stopping trades that could physically happen. So the gauge is a subtraction: how tight is money, minus how much has genuinely run out.
MONETARY BIND = mean z-score of four inputs:
\u00b7 high-yield credit spread (the price of credit risk)
\u00b7 net share of banks tightening business lending standards
\u00b7 real policy rate (fed funds minus core inflation)
\u00b7 real money growth, inverted (starvation when negative)
REAL BIND = intensity of genuine physical scarcity
(supply-chain pressure, energy or transit disruption, true labor shortage)
TIPPING POINT: CCI \u2265 +1.0 sustained for a quarter
That subtraction is the whole trick. The four money measurements are ordinary things any economist tracks. What makes this the framework’s own is that tight money only counts as faking when there is nothing real to justify it. One full standard deviation of unjustified squeeze, held for a quarter, is where the line sits. That is the point at which money starts stopping trades the physical world would happily allow.
The gauge
Twenty years, two crossings
Run it back to 2006 and you get eighty-two quarters of readings, plus two projected. Four of them cross the line: the last quarter of 2008, the first of 2009, and the second and third of 2023. Fifteen years separate the two episodes. In between, the index warned, retreated, and went deeply negative, and never once held above the line. That pattern is not noise.
The 2008 reading holds a subtlety worth sitting with. For the first three quarters of that year, money was already extreme. Credit spreads blowing out. Banks refusing to lend at rates not seen since the early 1990s. And yet the index stayed clear of the line.
Why? Because oil was genuinely scarce. Crude hit a hundred and forty-five dollars in July 2008. Supply chains were genuinely strained. The real shortage cancelled out the money shortage almost exactly, and the gauge held at warning rather than crossing.
Then in the fourth quarter oil collapsed. The real shortage evaporated. And the money shortage was left standing there alone. The index hit plus 1.42.
Which means the financial crisis reads, in this framework’s terms, as a credit counterfeit that had been temporarily hidden behind a genuine commodity shock. And the hiding was part of what made the unmasking so violent.
The years in between are just as instructive for what they do not show. The European debt crisis of 2011 registered only as a warning in America, because American money stayed loose and the real shortage had faded. The energy credit stress of 2015 and 2016, when spreads touched eight percent, reached warning but not crossing, because the trouble was confined to one sector while money overall stayed plentiful.
The gauge did not cry wolf either time.
And 2020 is the most striking negative of all. Banks tightened to seventy percent, the sharpest reading in the whole record, and the index fell to minus one and a half and kept going. The money flood was overwhelming. The shortages were real. Whatever was scarce in 2020 and 2021 was emphatically not credit’s doing, and the gauge said so.
Then the crossing. In the middle two quarters of 2023 the index went above the line and stayed there, and the fake shortages arrived on schedule.
Home sales collapsed toward their lowest level since 1995 while the number of houses per person did not change at all. Owners locked into three percent mortgages would not sell against seven, so the shortage of homes for sale was manufactured entirely by the money. Three banks failed in a system with plenty of deposits. Business lending shrank, small firms were paying past nine percent, and factory surveys sat below the boom-bust line for sixteen straight months while the factories stood idle.
And then the tell, which is this framework’s favourite kind of evidence. All of those shortages began dissolving as rates fell through 2024 and 2025. Nothing was built. Nobody added a house. The money was rearranged and the scarcity went away on the money’s schedule. That is what fake means.
Four crossings in eighty-two readings, in two episodes fifteen years apart. Both line up with textbook credit counterfeits. The fifteen years between include two near misses the gauge correctly refused to call.
Where it points today
The index reads minus 1.24 for the third quarter of 2026, against minus 1.36 in the second. The needle is still rising, but barely, and the August entry on this page had the same quarter at minus 1.08. That reading has been revised down, and the reason is worth going slowly over.
August called the oil problem fading. It came back.
The Strait reopened under the memorandum of 18 June, and the Energy Information Administration expected flows near pre-conflict levels by year end. Read in August, that looked like a trend. It was not. Transit has been selective rather than open, with Iran waving through ships that negotiated terms or paid a toll and holding up the rest. Then September brought a sharp escalation. Brent is averaging around $104.70 this month against $91.10 last month, and traded near $104.60 on the eleventh.
So the real shortage did not continue to ease from 1.0. It was rescored upward to 1.15, and the quarter reads lower as a result.
The money side, meanwhile, did almost nothing again. The Federal Reserve’s rate sits in a range of 3.50 to 3.75 percent against core inflation of 3.3 percent, which leaves the real rate near plus 0.33 percent. Risky credit traded at 265 basis points on 3 September, still among the calmest readings in the series. The July survey of loan officers is the most recent one, and it reported lending standards basically unchanged. Real money growth is near 2.1 percent.
Summer 2026 money −0.09 − real shortage 1.15 = −1.24
August scored the summer quarter at −1.08 on a real shortage of 1.00.
The money side moved by three hundredths. Everything else was the Strait.
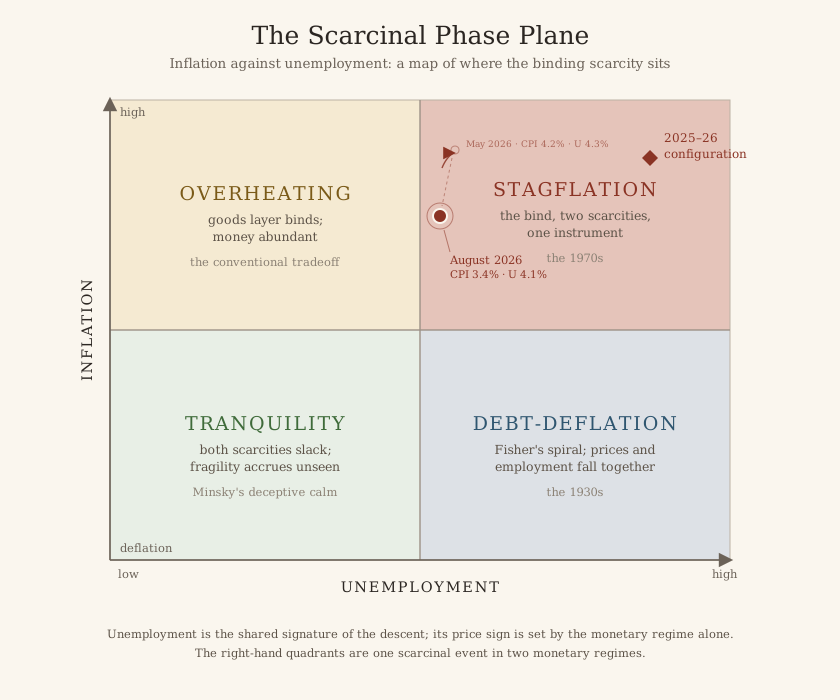
Twice now this gauge has moved for one reason, and it was never money. In August a receding shortage pushed it up. In September a returning one pulled it back. The monetary side has sat within a tenth of zero through both.
That is the honest read, and it cuts against the instrument’s own headline. A gauge built to detect money faking a shortage is currently being driven, in both directions, by a shortage that is entirely real.
There is a forward change too. Markets price a rise to 3.75 to 4.00 percent at the meeting on 16 September, after the Chair’s hawkish remarks at Jackson Hole in late August. If it lands, higher energy prices will absorb much of it in real terms, which is why the fourth quarter is projected at minus 1.20 rather than materially higher. A rate rise into an oil shock does less to the real rate than it looks like it should.
Suppose instead the Strait opened completely and the real shortage went to zero, with every money setting left exactly where it is today. The gauge would sit at about minus 0.1, because that is what the money side alone reads. The oil problem cannot carry this index to plus 1.0 in either direction, no matter what it does.
Getting to the line takes the money side itself rising by roughly a full standard deviation. In plain terms: credit spreads at genuine crisis levels, banks refusing to lend at net shares in the tens rather than the low single digits, and a real interest rate several points higher than today. None of those is present. None is close.
And one admission, because the series should carry its own errors. The August entry treated a partial reopening as a direction of travel. A chokepoint can reverse inside a quarter faster than a quarterly judgment series can honestly be rescored, and that is a limitation of this instrument, not a detail of this quarter.
The gauge has a blind spot
The more important part of this update is not the number. It is that four other pieces on this site have now found the same blind spot, and this gauge is the one that started the list.
It read minus 1.31 in a quarter when subprime car loans were posting their worst record in thirty-two years. An instrument that says credit is not binding, during a quarter when credit was plainly binding for the households at the bottom, has a problem no decimal place will fix.
The July survey shows exactly how it happens, inside one document, which is why it is worth stating precisely rather than in general terms.
In the same release, banks reported charging narrower margins to large companies, and a net share reported tightening standards on credit cards. Two opposite movements. One survey. One quarter. The number this gauge takes from that survey is the business lending line, which nets out to basically unchanged.
So the gauge records a quiet quarter. And the quiet is an average of an easing at the top and a tightening at the bottom.
What the same survey also said:
· cheaper borrowing for large companies
· a net share of banks tightening up on credit cards
The average is not wrong. It is the middle of two
opposite signals, and this framework cares about both.
The household data says the same thing, more slowly. The New York Fed put total household debt at $18.8 trillion in the spring, with 4.7 percent of it late, and the headline improved slightly. Underneath it, car loans going seriously bad rose from 2.93 to 3.0 percent over the year, and mortgages going seriously bad rose from 1.29 to 1.52 percent, which is up nearly a fifth. The average improved. Two of its parts did not.
The fix, and why it is not here yet
The obvious repair is a fifth measurement, one that watches credit at the bottom rather than at the top. Consumer lending standards instead of business ones. Car and card delinquencies. The share of credit applications getting turned down.
It is not being added today, for a reason worth stating out loud rather than burying.
This gauge’s only real asset is a consistent history back to 2006 and two crossings it identified under a fixed definition. Adding a measurement now, knowing what the last two years did, would let this framework tune the instrument to fit a period it has already read. The resulting track record would be worth nothing.
The honest sequence is to define the new measurement, publish the definition before the next reading, and score it forward from a date already on the record.
A gauge quietly improved every time it misses something is not an instrument. It is a narrator. The blind spot gets published today and the repair gets dated forward, which is the only version of this anybody can check later.
So the standing call gets restated rather than reissued. The gauge will not approach its line while the real interest rate sits near zero, credit spreads price almost no risk, and a genuine energy shortage persists. Crossing requires the money side to rise while the real side falls. As of August 2026 the real side is falling slowly and the money side is not rising at all.
The next thing that could change that is not a rate decision. It is the Strait reopening while everything else stays exactly where it is.
What this instrument has committed to
Each line below is a claim this instrument has committed to, with the observation that would prove it wrong. Status updates every quarter alongside the gauge.